The world of lipids is a complex one. Lipids range from membrane phospholipids, fatty acids and sterols, through to the steroid hormones, cannabinoids, pheromones and plant pigments. It’s tricky to make sense of such a vast array of chemistry.
That’s where LIPID MAPS comes in. The LIPID MAPS consortium (www.lipidmaps.org) was formed over 20 years ago in the USA and sought to explore the lipidome. To do this, lipids had to be first defined, and then classified. The LIPID MAPS classification system is now internationally recognised, and we also provide a host of resources, databases and tools to support the lipidomics community in their research.
CLASSIFYING LIPIDS
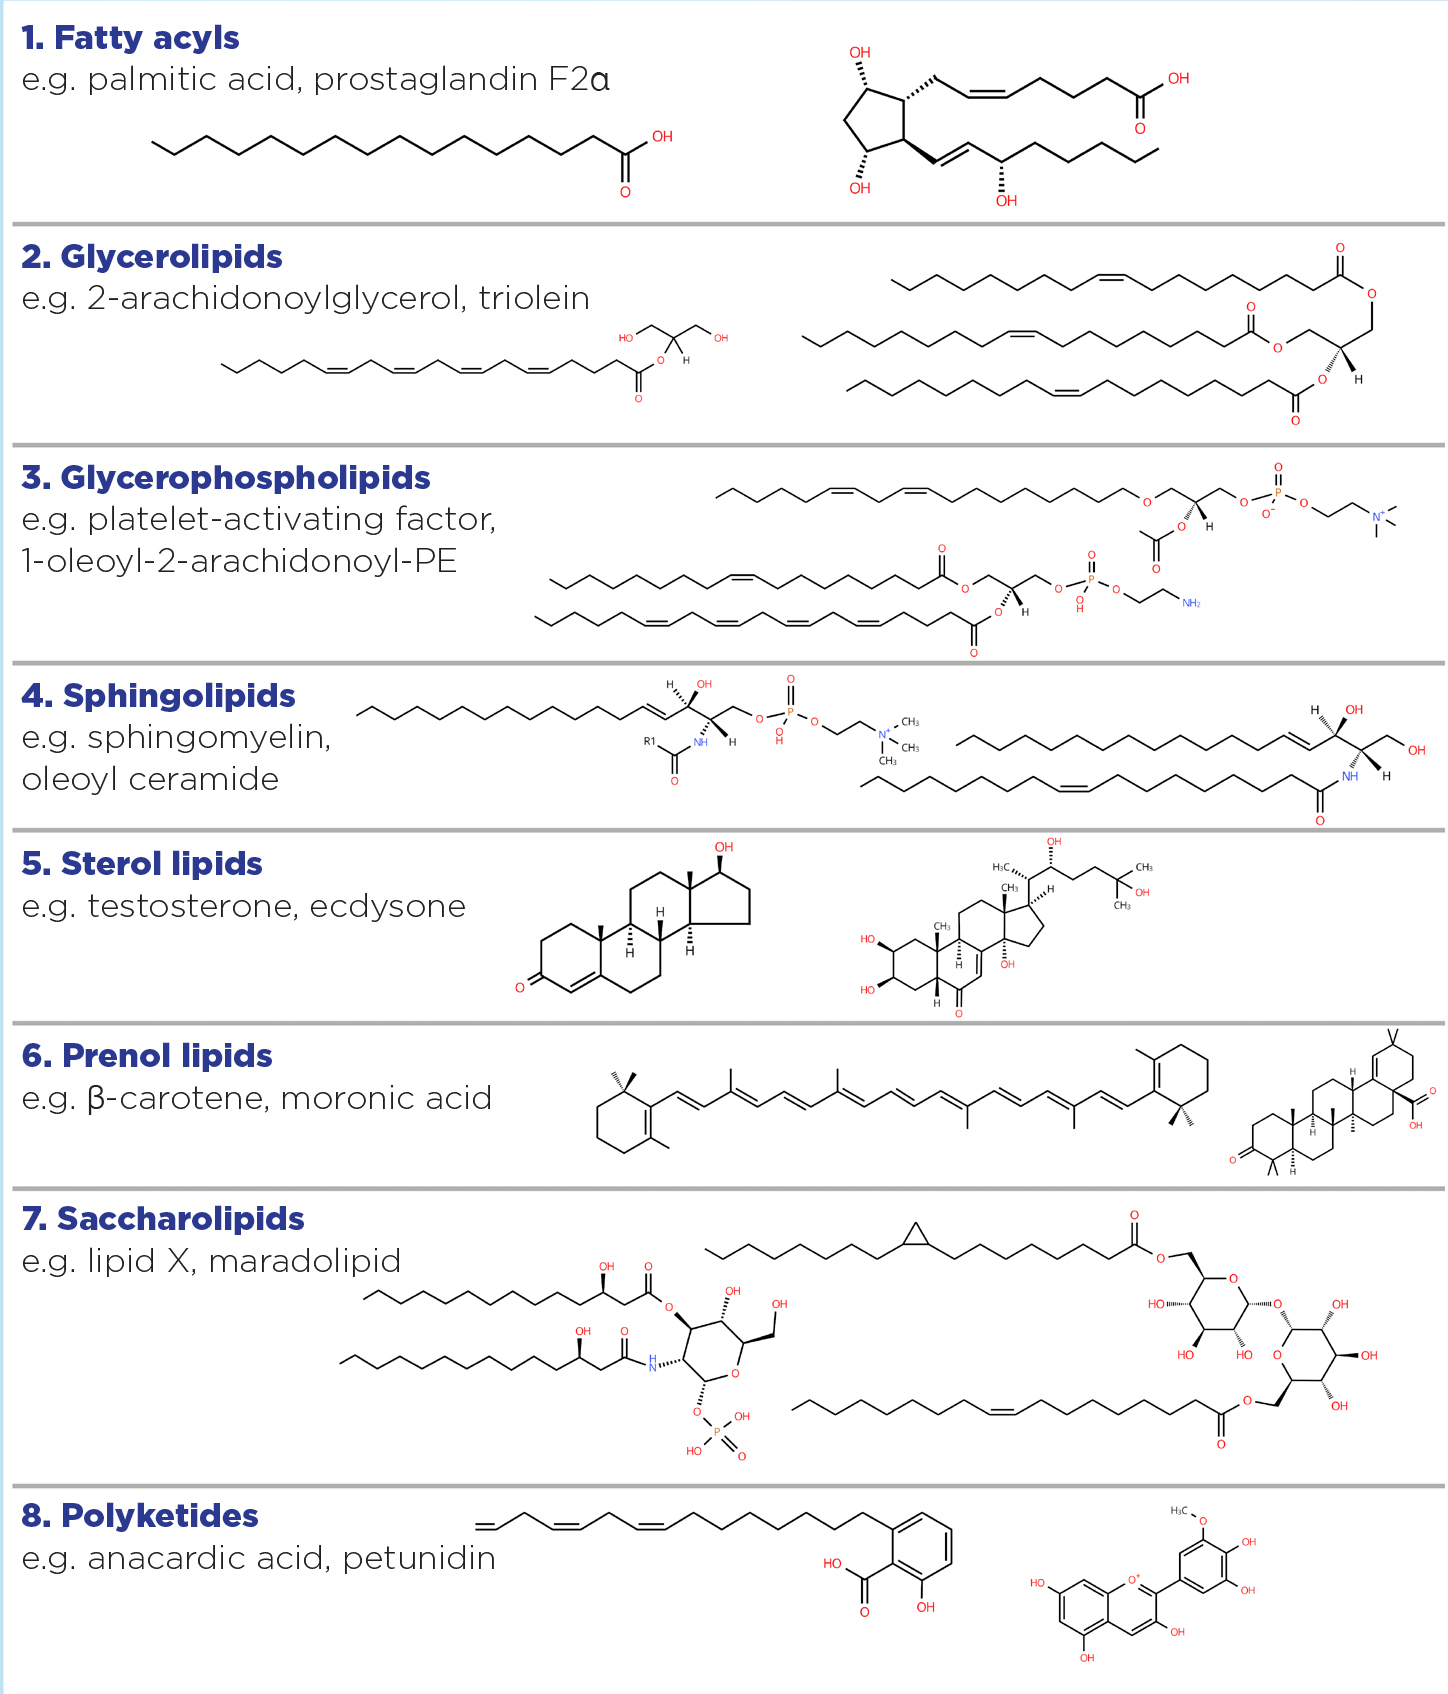
LIPID MAPS defines lipids as hydrophobic or amphipathic small molecules formed by condensations of thioesters and/or isoprene units. They are classified into eight categories (see Figure 1), each sub-divided into two or three more levels.1 These cover fatty acids through to antibiotics, via sterols and steroid hormones.

Figure 1. The eight LIPID MAPS categories to classify lipids, and examples of each.
HOW TO EXPLORE LIPIDS
This classification system organises the LIPID MAPS Structure Database (LMSD; www.lipidmaps.org/databases/lmsd), containing over 48,000 lipids from all domains of life. Now based in the UK, but with international partners, our new MRC funding will allow us not only to expand the database with more lipids, but also to add biochemical reactions and pathways by which they are made and degraded.
Lipids in the database come from the scientific literature, but many have also been brought in from other databases too. Each lipid has its own dedicated web page showing the two-dimensional structure of the molecule and, optionally, a three-dimensional model can be displayed. Names and synonyms are listed along with the mass and formula, and a facility to calculate m/z values for various adducts. Where available, links to mass spectra in the Massbank of North America are provided, as are cross references to other databases such as ChEBI and PubChem. Recently we’ve been adding the information about where a lipid has been curated from, including the taxonomic species, to aid users in finding more context for the molecule in question.
HAVE WE CATALOGUED ALL THE LIPIDOME?
From the whole of life, absolutely not (yet!), and almost certainly there are molecules to be added, even from humans. In terms of documenting the reactions which transform lipids, we’ve only just begun. Please do get in contact if you spot a hole!
HOW DO RESEARCHERS MINE THE DATA?
The database can be browsed via the classification hierarchical tree, or searched directly from the top of the LIPID MAPS homepage using names, formulae, m/z values or computational identifiers. More advanced search functionality allows searching for chemical substructures as well as properties, such as the number of hydroxyls and/or double bonds. No specialist skills are needed to look through the LIPID MAPS databases, and the whole site is freely available to everyone.

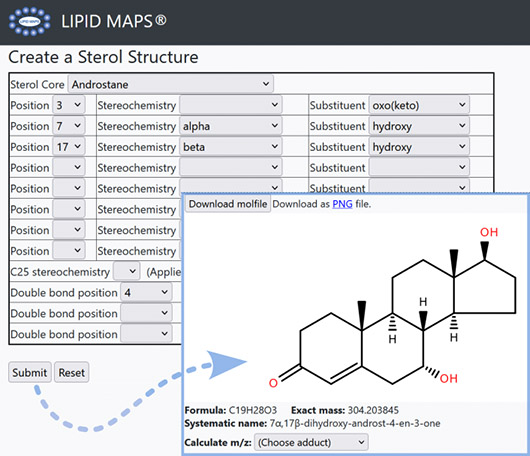
Figure 2. The sterol drawing tool at LIPID MAPS. Input the parameters and a diagram of the molecule is produced, in this case, 7α-hydroxytestosterone.
A RANGE OF TOOLS
We’re not just about cataloguing lipids, there is a range of tools available for mass spectrometry and lipidomics analysis too. There are also tools for structure drawing, to generate diagrams of chemical structures for a range of lipids in standardised orientations. We’ve just updated the sterol drawing tool to include the three classes of steroid hormones: pregnanes, androstanes and estranes. Simply input information about the molecule as shown in the image, such as position of double bonds, and the tool outputs a diagram for you (Figure 2).
HOW TO INTERACT WITH LIPID MAPS
We’ve made lots of updates in the last few years; check out our recent paper that describes them.2 There’s a range of educational resources on the LIPID MAPS site, including podcasts and monthly webinars which are streamed live and also available on our YouTube channel (@lipid_maps).
Our regular ‘Lipid of the Month’ feature highlights a particular molecule which might be involved in anything from modulating appetite to moulting in insects. Our 2021 training school presentations are there too, and we’re planning our next training school (face-to-face) for next year. We’re also on X (@lipidmaps) as well as Facebook and LinkedIn, and there’s a community forum linked from our homepage. We look forward to seeing you!
MATTHEW CONROY
Biocurator, LIPID MAPS Databases, based at Cardiff University.
REFERENCES
1. Fahy E et al. 2005 Journal of Lipid Research https://doi.org/10.1194/jlr.e400004-jlr200.
2. Conroy MJ et al. 2024 Nucleic Acids Research https://doi.org/10.1093/nar/gkad896.


